Introduction to Data Visualization with Altair
Why Visualize Data? The Tale of Anscombe's Quartet
In data analysis, summary statistics like mean, variance, and correlation provide a concise numerical overview of our datasets. However, relying solely on these statistics can sometimes be misleading.
Consider Anscombe's Quartet, a set of four distinct datasets created by statistician Francis Anscombe in 1973. Let's look at their primary summary statistics:
| Statistic | Dataset I | Dataset II | Dataset III | Dataset IV |
|---|---|---|---|---|
| Mean of X | 9.0 | 9.0 | 9.0 | 9.0 |
| Mean of Y | 7.50 | 7.50 | 7.50 | 7.50 |
| Variance of X | 11.0 | 11.0 | 11.0 | 11.0 |
| Variance of Y | 4.125 | 4.123 | 4.123 | 4.123 |
| Correlation X,Y | 0.816 | 0.816 | 0.816 | 0.817 |
| Linear Regression | y=3+0.5x | y=3+0.5x | y=3+0.5x | y=3+0.5x |
Based on these numbers, the datasets appear remarkably similar! However, visualization tells a dramatically different story.
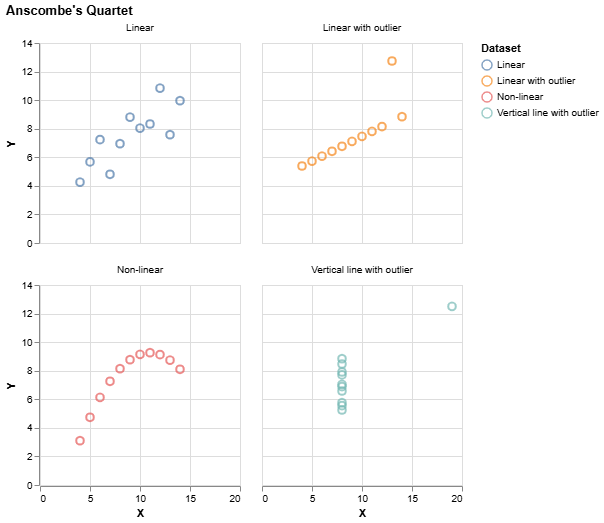
This powerful example underscores why data visualization is crucial. It helps us to: * Identify patterns, trends, anomalies, and relationships within datasets to guide further analysis. * Understand data distributions. * Communicate findings effectively. * Build intuition about the data that numbers alone cannot provide.
In this course, particularly for business decision-making, turning raw data into actionable insights often hinges on effective visualization.
What is Altair?
Altair is a declarative statistical visualization library for Python. But what does "declarative" mean in this context?
- Declarative Visualization: You describe what you want to see, specifying the data and how different data features should map to visual properties. Altair then handles the "how" of rendering the plot. This contrasts with imperative plotting tools where you often build plots step-by-step (e.g., draw axis, draw points, add labels).
- Based on the Grammar of Graphics: Altair's design is rooted in the principles of the Grammar of Graphics (specifically, Vega and Vega-Lite). This grammar provides a strong theoretical foundation for building a wide array of statistical graphics by combining a few key components:
- Data: The dataset you are visualizing (typically a table-like structure).
- Marks: Geometric objects that represent your data (e.g., points, bars, lines, areas).
- Encodings: Rules that map data fields (columns) to the visual properties of marks (e.g., x-position, y-position, color, size, shape, opacity).
By understanding these core concepts, you gain a deeper, more adaptable understanding that transcends rote memorization of specific chart recipes.
Altair's Core Idea: The Chart Object and Encodings
The fundamental structure of an Altair visualization is surprisingly simple and consistent:
import altair as alt

# Assuming 'my_data' is a Polars (or Pandas) DataFrame
chart = alt.Chart(my_data).mark_point().encode(
    x='data_column_for_x_axis',
    y='data_column_for_y_axis',
    color='data_column_for_color'
    # ... other encoding channels
)
Let's break this down:
alt.Chart(my_data): This creates aChartobject. It takes your dataset (e.g., a Polars DataFrame) as the primary argument..mark_type(): This method specifies the type of geometric mark you want to use to represent your data. Examples includemark_point(),mark_bar(),mark_line(),mark_circle(),mark_rect(), etc..encode(...): This crucial method defines the encoding channels. Here, you map columns from your dataset to visual properties of the marks. Common encodings include:x: Position on the x-axis.y: Position on the y-axis.color: Mark color.size: Mark size.shape: Mark shape (for point marks).opacity: Mark transparency.tooltip: Information to display on hover.
Setting up Altair in Your Environment
To use Altair, you'll need to install it and its dependencies. For this course, we'll also use vega_datasets for sample data and polars.
Installation: This step is not required for Google Colab. All three packages are preinstalled. If you are using a different coding environment, you may need to execute this command.
Importing into your Python script or notebook:
import altair as alt
import polars as pl
from vega_datasets import data as vega_data # For loading sample datasets
Enabling the Renderer: Altair needs to know how to display charts in your specific environment (Jupyter Notebook, JupyterLab, Google Colab, etc.).
# For Google Colab
alt.renderers.enable('colab')

# For JupyterLab
# alt.renderers.enable('jupyterlab')

# For classic Jupyter Notebook
# alt.renderers.enable('notebook')

# Default renderer (often works well across environments)
# alt.renderers.enable('default')
alt.renderers.enable('colab') will be our standard.